

Economic issues top the list of most important problems facing the country, and immigration and border security top the list of state issues in the University of Texas/Texas Tribune Poll, which also asked Texans about a range of issues including education spending, voting rights and gay marriage.
Three in five Texans put economic matters at the top of their lists, with 31 percent choosing the economy, 17 percent choosing federal spending/national debt and 14 percent choosing unemployment/jobs. That’s been the top issue for over a year and remains so with the general election under way.

“This is a pretty good representation of what the state of the state is right now,” said Daron Shaw, co-director of the poll and a political science professor at UT-Austin.
The economy made the top of the Texas list for only 11 percent; 14 percent said immigration is the most important problem facing the state, and 13 percent said border security is No. 1. While the national list fell off quickly after the top item, the Texas list had several issues close behind the leading items: education, listed first by 10 percent, and unemployment/jobs and political corruption/leadership, both at 9 percent.
“Education, stripped of context, tends to get support from people,” said Jim Henson, director of the Texas Politics project at UT-Austin and a government instructor there. “People feel like they should support education, and abstracted from context and cost, they do. But when you put it in the context of other priorities, people tend to shift education down.”
Both pollsters said education hasn’t risen to the top of voter concerns as some expected after budget cuts during the last legislative session.
“We’re still kind of waiting for the other shoe to drop on education, and it’s not clear that it’s going to,” Henson said.
Voting rights

Most Texans — 66 percent — believe voters should be required to present photo IDs when they vote. The Legislature agrees with that and passed a law saying so, but it hasn’t passed federal muster and isn’t in use during these elections.
Most of those voters — 51 percent — think states with a history of discrimination in their election laws should have to get federal approval before they change those laws, while 36 percent think those states should be able to make changes without checking in with Washington, D.C.
Same-sex partnerships

Voters here remain open to some form of legal partnership for gay and lesbian couples, with 36 percent saying they would allow those couples to marry and another 33 percent saying they would allow civil unions but not marriage. Another 25 percent said those couples should have neither the right to marry nor form civil unions. Read one way, 69 percent would allow some form of legal partnership; read another, 58 percent are against same-sex marriage in Texas.
Shaw said the polling reveals some nuances in the positions Texans take on various issues — and same-sex partnerships are an example of that.
“Collectively, they jump out in the sense that they continue to demonstrate the pragmatism of the Texas electorate,” he said. “We get into this red-state, blue-state mindset, particularly as the election nears. But we continue to find in the polling in Texas that on issues like gay marriage, voter ID, that if you give people the opportunity to take, instead of a black-and-white option, more of a grey option, a good subset of Texans will take that.”
Immigration
In-state college tuition for illegal immigrants who graduated from Texas high schools and who have lived in the state for at least three years is a nonstarter for 50 percent, who said those students should pay out-of-state tuition. Another 36 percent support the current state law that allows them to pay in-state rates.
Most of the respondents — 62 percent — said police should be allowed to inquire about or report the immigration status of people they encounter on the street, including 46 percent who feel strongly about it. Another 31 percent think police should not be permitted to do that.
Most immigrants don’t pay their fair share of taxes in the view of 59 percent of those polled; 33 percent said immigrants do pay their fair share.
The vast majority — 76 percent — believe the U.S. should “restrict and control people coming to live” here more than we do. At the same time, 63 percent agreed that newcomers from other countries “enrich Texas with their hard work and values.”
How often do they come into contact with immigrants who speak little or no English? Daily or weekly, according to 57 percent; monthly, 31 percent; and only once a year or so, 10 percent.
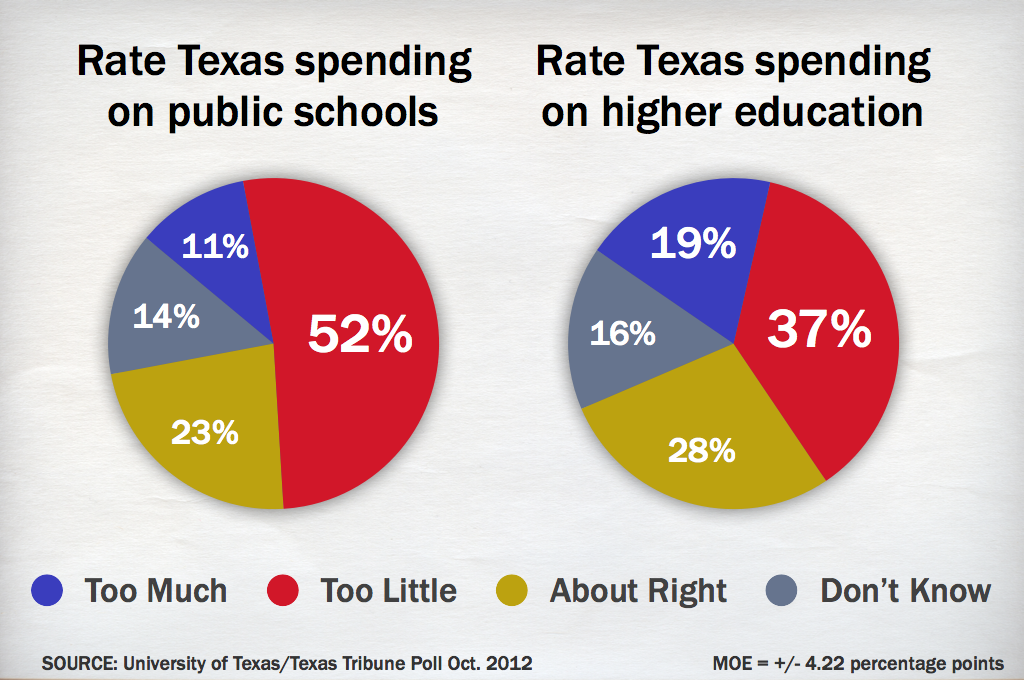
Education and spending
Only 11 percent said the public schools in Texas are better than they were a year ago; 34 percent said they are about the same, and 43 percent said they are “somewhat” or “a lot” worse.

A small majority said the state spends too little on primary and secondary education, while 11 percent said the state spends too much.
Higher education spending is about right, according to 28 percent; 37 percent said the state spends too little on its colleges and universities, and 19 percent said it spends too much.
Voters lean toward spending cuts over revenue increases when presented with a question of how to close a state budget gap. However, slightly more than half think candidates should wait until the fiscal situation is clear in January 2013 before they take a no-taxes oath. About a third said candidates should take that pledge before the elections instead.
“People are quite willing to spend more of their own tax dollars if they are convinced the problems are going to be solved or addressed,” Shaw said. “Where they get off the tax ship, if you want to call is that, is that they do not trust the state and certainly not the federal government to deliver the goods. There is a willingness to commit funds to solve certain problems, but there is a fundamental cynicism about government’s ability to effectively address those issues.”

The University of Texas/Texas Tribune internet survey of 800 voters was conducted Oct. 15-21, 2012, and has a margin of error of +/- 3.46 percentage points. Numbers in the charts might not add up to 100, due to rounding. “Likely voters” were defined as those who indicated they were “somewhat” or “extremely” interested in politics and who said they voted in “every” or “almost every” election in recent years. The margin of error for questions confined to likely voters is +/- 4.22 percentage points.
[This is the third of five stories on the latest University of Texas/Texas Tribune Poll. Tomorrow: How Texans view federal and state government.]
Texas Tribune donors or members may be quoted or mentioned in our stories, or may be the subject of them. For a complete list of contributors, click here.


