On the Records: Mapping GOP Gains
/https://static.texastribune.org/media/images/20100112-capitol7_cbm.jpg)
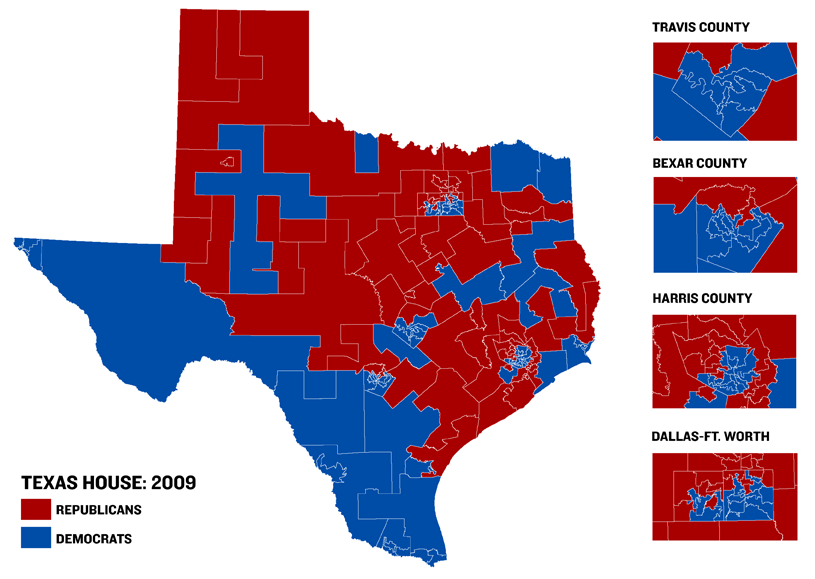
The geography of state politics changed Tuesday night, with Republicans taking control of 99 seats in the Texas House — the largest majority for either party since 1983.
This takeover is striking when seen on a political map. Texas is — at least geographically — more red after Tuesday's GOP wave.
First, the 2009 map, which reflects the Democrats' strength in urban areas, but also in swaths of East Texas and the Panhandle:
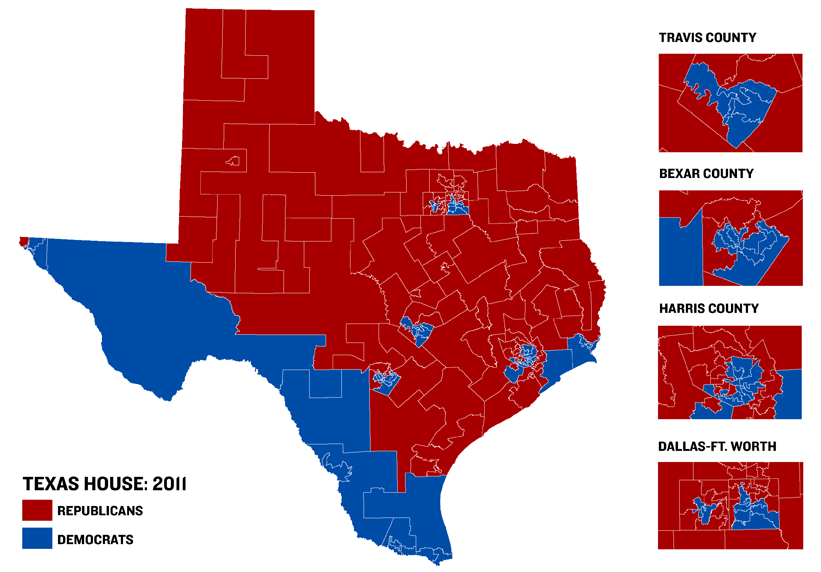
No more. The 2011 map shows a real divide, with Democrats losing everywhere except pockets of urban counties, far southeast Texas and the border:
Please let us know if you have feedback or ideas for future visualizations. Be sure to follow @TribData on Twitter for updates.
Texas Tribune donors or members may be quoted or mentioned in our stories, or may be the subject of them. For a complete list of contributors, click here.
Information about the authors
/https://static.texastribune.org/media/profiles/TxTrib-Staff_0016_StilesMatt800.jpg)
Matt Stiles
Reporter and News Apps Editor
Learn about The Texas Tribune’s policies, including our partnership with The Trust Project to increase transparency in news.