Analysis: See How Texans Turn Out, Vote in Presidential Elections
/https://static.texastribune.org/media/images/2016/05/31/ClintonTrump-Split.jpg)
Editor's note: If you'd like an email notice whenever we publish Ross Ramsey's column, click here.
The national political conventions are over and the nominations are complete. It’s been weird, hasn’t it?
Maybe you remember what a normal general election in Texas looks like. It’s both encouraging and discouraging. Voter turnout in Texas is at its peak in presidential-year general elections, but peak voter turnout in Texas still means half of the adults in the state do not cast ballots.
If you are both a relentless optimist and a voter, the effect is to double your electoral clout. Feel the power.
As we start this 99-day sprint to Election Day (and somewhat in the spirit of the summer Olympics), it seems like a good time to open the records and see what Texas voters have done in past presidential election years.
Caveat suffragator: Past results and turnout numbers are history, not future. These are not predictions.
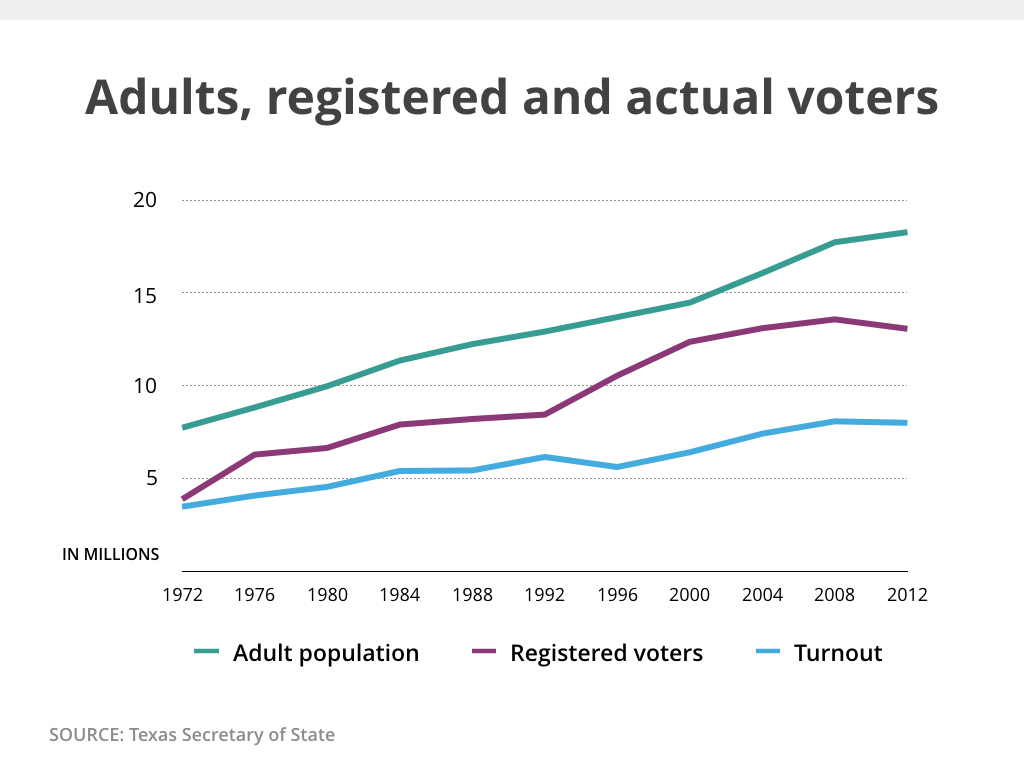
The state’s voting-age population — everybody in Texas who is at least 18 years of age — grew from 7.7 million in 1972 to 18.3 million in 2012. That’s according to the Texas secretary of state, the operator of state elections and keeper of the numbers underlying these charts.
The number of registered voters rose. In 1972, there were 3.9 million in 1972 and 13.1 million 40 years later.
Just as not all adults register to vote, not all registered voters show up to cast ballots. Just under 8 million Texans voted in the 2012 general election, which means about 5.1 million registered voters never cast a ballot in that election.
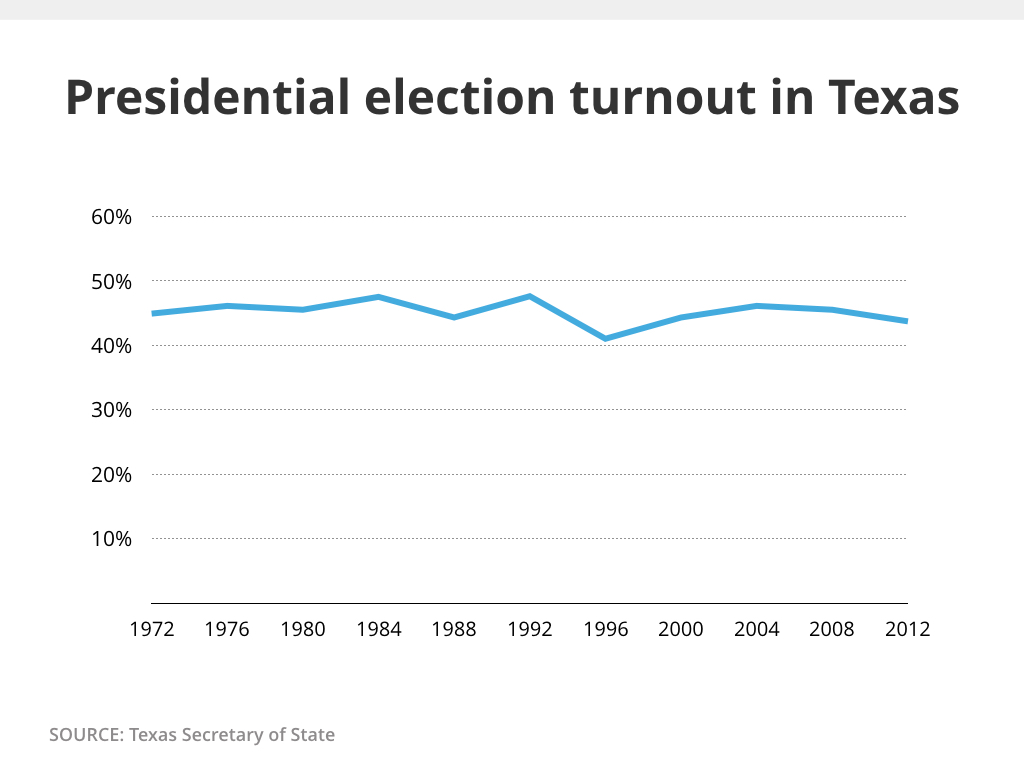
Another way to look at turnout is to throw out the state’s growth and look at how much of the voting age population took part in the elections. It’s surprisingly flat, never going above 50 percent or below 40 percent over the past 11 presidential elections.
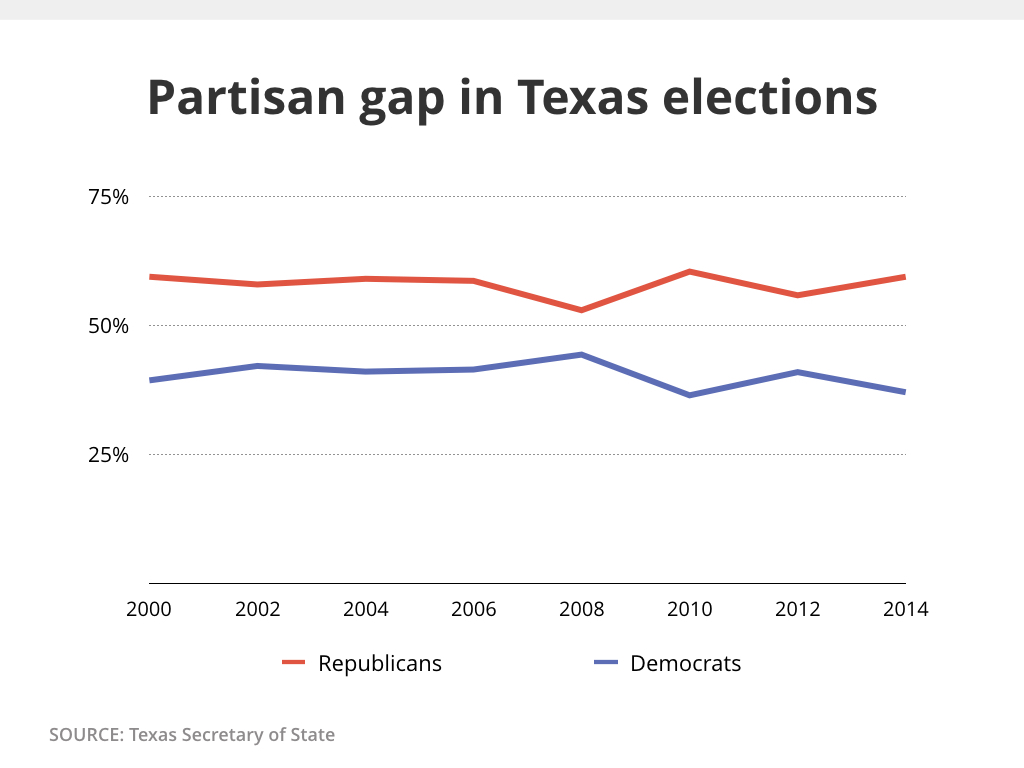
Republicans have had the upper hand in Texas elections for the past two decades, winning every statewide election starting in 1996. Since 2000, the size of that advantage has changed from year to year; in the latest two presidential elections, it shrank, expanding again in the interim years when Texas elects its governors and most other statewide officeholders.
The numbers here represent the averages for Republicans and Democrats in statewide elections where both major parties had candidates. Races that featured a Republican and one or two third-party candidates were not included since this is a measure of the strength of the major parties.
The average margin for this period was the smallest in 2008, when the average statewide candidates were separated by 8.6 percentage points, and the largest in 2010, when they were 23.9 percentage points apart.
The general elections will be competitive again when the lines cross, which they haven’t done since 1994.
Information about the authors
/https://static.texastribune.org/media/profiles/ramsey-ross_TT.jpg)
Learn about The Texas Tribune’s policies, including our partnership with The Trust Project to increase transparency in news.